Contents
[course] 모두를 위한 딥러닝 강좌 04
2020/01/16
이 포스팅은 인프런 머신러닝 강좌 를 수강하며 공부한 내용을 정리한 것입니다.
코드 출처
Lecture 4. Multi-Variable Linear Regression
How to handle multi-variable
Predicting exam score
-
regression using one input (x)
- one-variable, one-feature
기존에 수행하던 방식은 위와 같은 단일 변수에 의한 데이터에 기반하고 있다.
-
regression using three inputs (x1, x2, x3)
- multi-variable/feature
이처럼 여러 개의 변수를 다뤄야 하는 경우 Hypothesis는 어떻게 구할까?
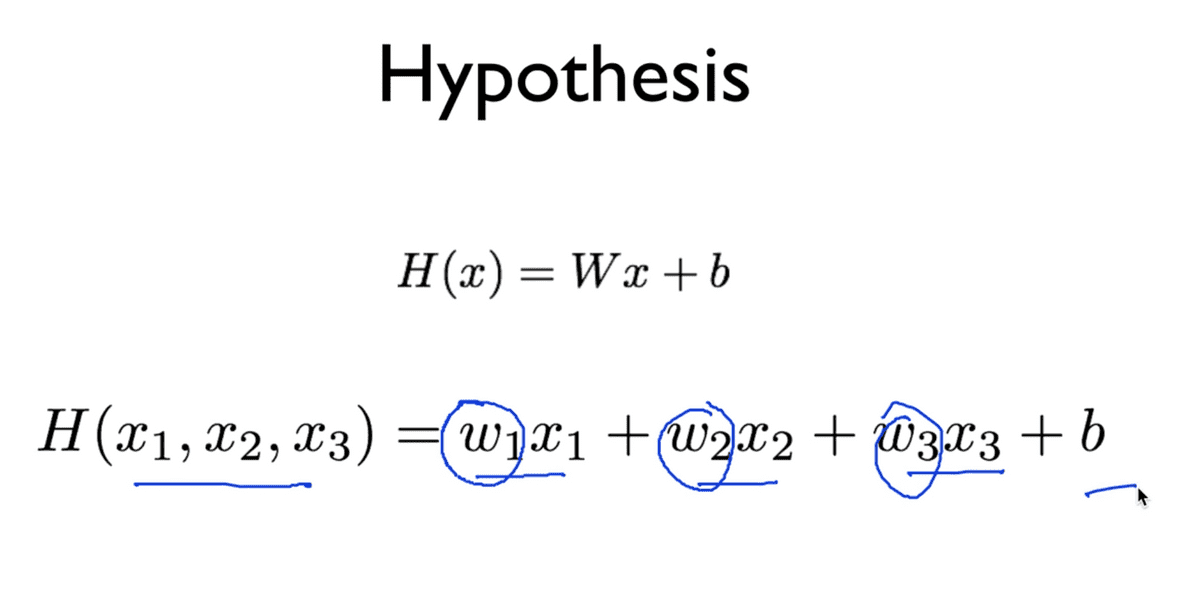
위처럼 간단히 생각해서 각각에 대한 W와 x의 값을 곱해서 모두 더해주면 된다.
그렇지만 기존의 방식과 달리 학습시켜야 할 내용이 늘어난 것이다.
그렇다면 Cost function의 경우는 어떨까?
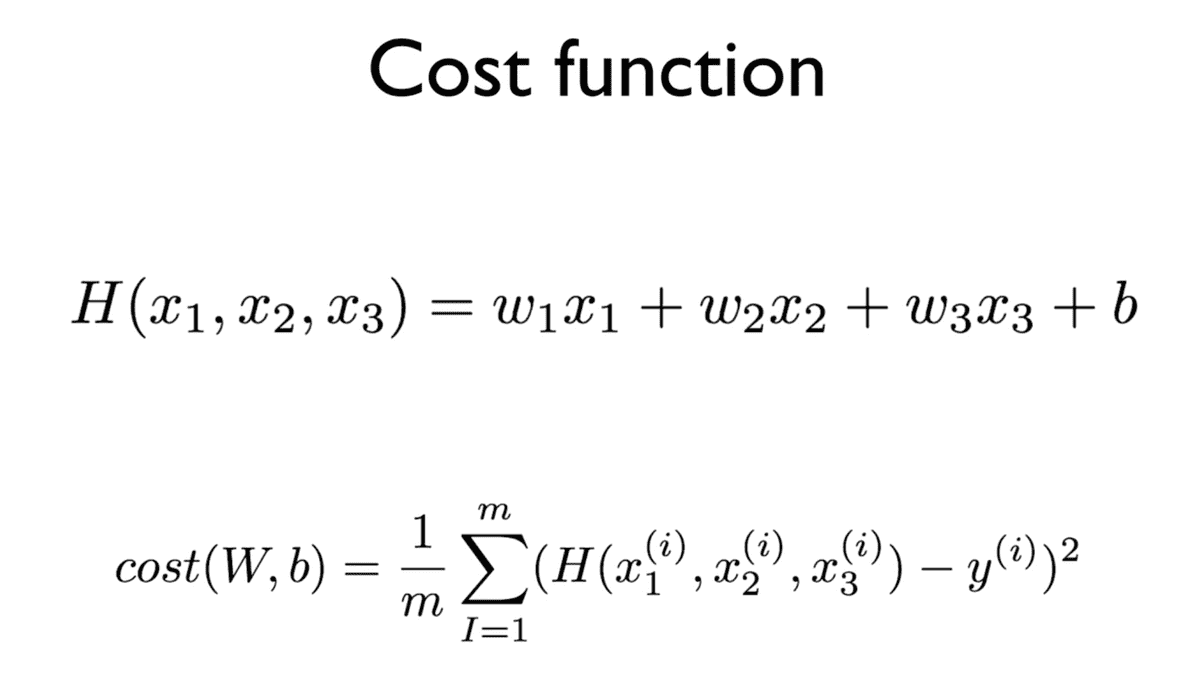
Cost function의 틀은 결국 같으나 바뀐 것은 우리의 가설, 즉 Hypothesis이다.
변수가 두세개가 아닌 훨씬 더 많을 때에도 마찬가지이다.
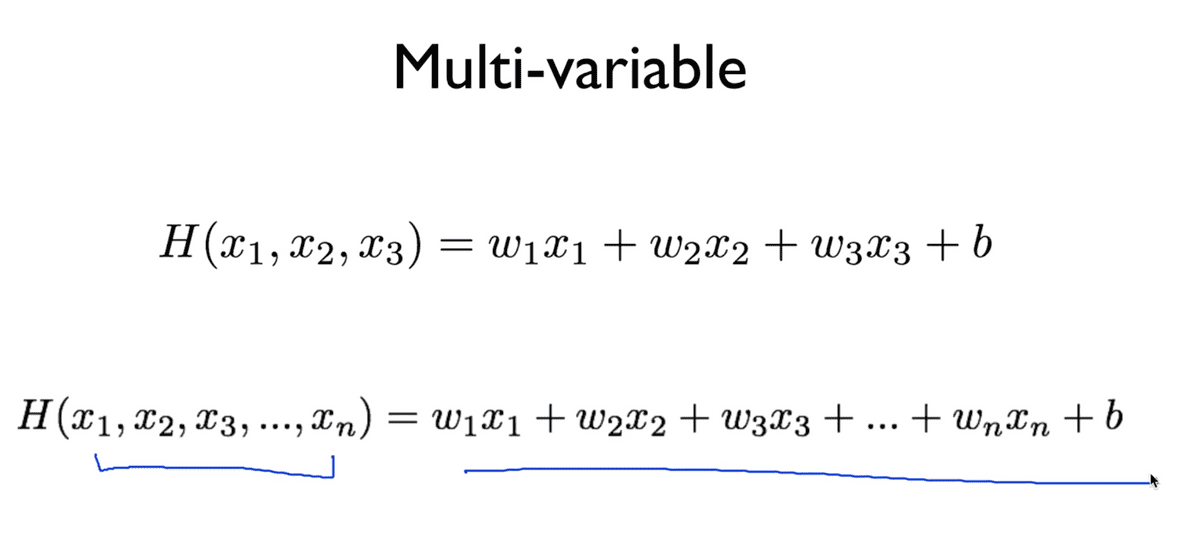
그저 마찬가지로 변수의 개수를 늘려주면 되는데, 변수가 많으면 많아질수록 항의 개수에 따라 수식을 길게 늘어뜨려 써야 해서 불편함이 발생하게 된다. 이것을 처리하기 위해서 Matrix의 개념을 도입하게 되는데, Matrix의 곱셈만을 사용할 것이다.
Hypothesis using matrix
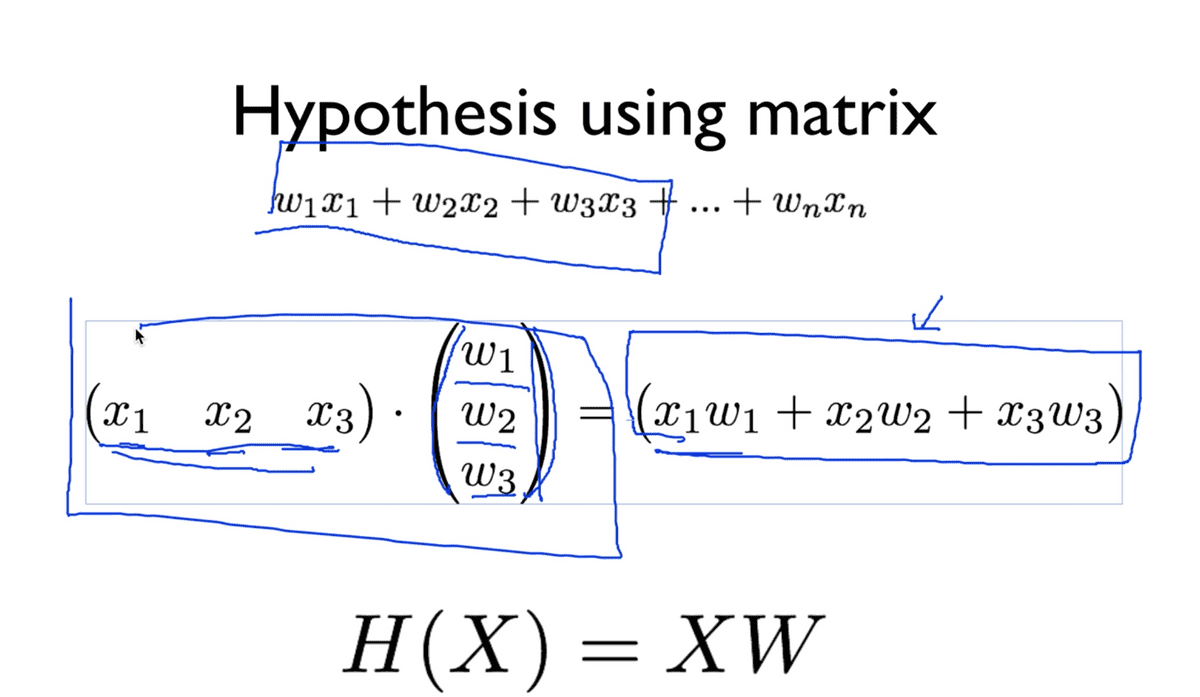
Matrix를 사용하게 되면 길게 늘어진 수식을 위와 같이 간단하게 표현하고 연산할 수 있다.
X에 대한 집합을 1*3 Matrix, W에 대한 집합을 3*1 Matrix로 두고
곱셈을 수행하면 우리가 원하던 수식을 연산할 수 있으며 하단과 같이 Matrix간의
곱셈 식으로 우리의 Hypothesis를 표현할 수 있다. (Matrix에서는 보통 X를 앞에 둔다.)
이 개념을 도입해서 위의 표에서 살펴본 x변수가 세 개인 성적 예측 문제를 다뤄볼 수 있다.
그런데 위의 표에서 확인한 것처럼 x1, x2, x3로 이루어진 한 묶음의 데이터 셋이
하나가 아니고 여러 줄로 이루어진 것을 알 수 있는데,
이 한 줄의 묶음을 instance라고 부르며, 이 instance들이 지금처럼 많을 때에는
물론 이를 반복적으로 수행하는 것도 방법이겠지만, 효율성 면에서 좋지 않다고 판단할 수 있다.
이 상황에서 Matrix의 굉장히 놀라운 장점은, x 변수들로 이루어진 각 인스턴스들에
대하여 표의 모양 그대로 하나의 Matrix를 줄 수 있다는 점이다.
다시말해, Hypothesis를 구성할 때, 아래처럼 x 변수에 대한 인스턴스들을
전부 하나의 Matrix로 만들고 하나의 W와 곱셈을 수행하기만 하면 되는 것이다.
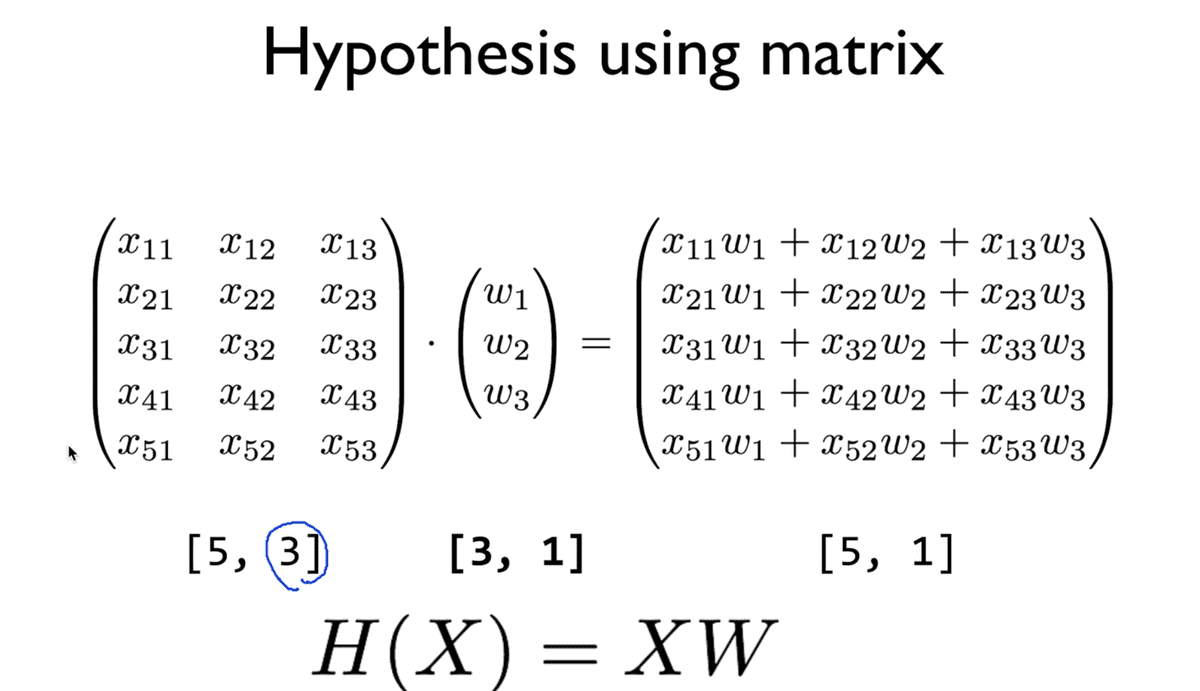
그러면 이러한 형태의 Matrix 연산을 많이 하게 될 텐데
x에 대한 Variable의 개수와 Instance의 개수는 이미 주어진 상태이므로
Matrix X가 주어진 상태라고 볼 수 있게 된다.
또한 곱셈의 결과인 H는 행의 개수가 instance의 개수이고
y값은 하나이므로 이 또한 마찬가지로 주어진다고 볼 수 있다.
대부분의 경우 이러한 상황에서 W에 대한 매트릭스의 크기를 결정하는 것이
가설 설정의 일부분이라고 할 수 있다.
이는결국 행렬 곱셈의 원리를 알고 있다면 충분히 직관적으로 떠올릴 수 있는데
W는 곱셈의 우측에 해당하므로 행의 크기로 X의 Variable 개수,
그리고 열의 크기로는 결과에 해당하는 y의 개수이므로 1이 됨을 알 수 있다.
출력의 개수가 한 개가 아니더라도, 우리가 원하는 출력의 개수에 대해서는
우리가 이미 알고 있다는 가정이 존재하므로 그에 따라서
W의 열의 개수를 결정할 수 있다.
또한 위 예젱서는 우리가 instance의 개수를 5개로 두었지만, 이는
데이터의 개수가 늘어남에 따라 가변적으로 달라질 수 있기 때문에 n으로 둔다.
(Numpy에서는 -1, TensorFlow에서는 None이라는 값으로 표현)
### lab 04-1: Multi-Variable linear regression을 TensorFlow로 구현
이론 시간에 표와 함께 살펴본 것과 같이 x 변수가 세 개로 구성된
성적 예측 문제를 실습할 것이다.
import tensorflow as tf
tf.set_random_seed(777)  # for reproducibility

x1_data = [73., 93., 89., 96., 73.]
x2_data = [80., 88., 91., 98., 66.]
x3_data = [75., 93., 90., 100., 70.]

y_data = [152., 185., 180., 196., 142.]

# placeholders for a tensor that will be always fed.
x1 = tf.placeholder(tf.float32)
x2 = tf.placeholder(tf.float32)
x3 = tf.placeholder(tf.float32)

Y = tf.placeholder(tf.float32)

w1 = tf.Variable(tf.random_normal([1]), name='weight1')
w2 = tf.Variable(tf.random_normal([1]), name='weight2')
w3 = tf.Variable(tf.random_normal([1]), name='weight3')
b = tf.Variable(tf.random_normal([1]), name='bias')

hypothesis = x1 * w1 + x2 * w2 + x3 * w3 + b

# cost/loss function
cost = tf.reduce_mean(tf.square(hypothesis - Y))

# Minimize. Need a very small learning rate for this data set
optimizer = tf.train.GradientDescentOptimizer(learning_rate=1e-5)
train = optimizer.minimize(cost)

# Launch the graph in a session.
sess = tf.Session()
# Initializes global variables in the graph.
sess.run(tf.global_variables_initializer())

for step in range(2001):
    cost_val, hy_val, _ = sess.run([cost, hypothesis, train],
                                   feed_dict={x1: x1_data, x2: x2_data, x3: x3_data, Y: y_data})
    if step % 10 == 0:
        print(step, "Cost: ", cost_val, "\nPrediction:\n", hy_val)
이론 시간에 살펴봤던 표를 바탕으로 코드를 위와 같이 작성할 수 있다.
이전과 크게 다를 것이 없으나, x_data와 placeholder, weight를
정의하는 부분이 개수가 늘어남에 따라 확장되었다는 것이 차이점이 되겠다.
결과는 아래와 같다.
0 Cost: 19614.8
Prediction:
[ 21.69748688 39.10213089 31.82624626 35.14236832 32.55316544]
10 Cost: 14.0682
Prediction:
[ 145.56100464 187.94958496 178.50236511 194.86721802 146.08096313]
...
1990 Cost: 4.9197
Prediction:
[ 148.15084839 186.88632202 179.6293335 195.81796265 144.46044922]
2000 Cost: 4.89449
Prediction:
[ 148.15931702 186.8805542 179.63194275 195.81971741 144.45298767]
이론 시간에 배웠던 내용을 떠올려 보면, 위와 같은 코드는 아름답지 않다는 알 수 있을 것이다.
만약 x_data가 지금은 3개이지만, 100개가 된다면? 매우 복잡해질 것이므로
이러한 방법은 권장되지 않고 사용되지 않는다. 따라서 Matrix를 사용한다.
import tensorflow as tf
tf.set_random_seed(777)  # for reproducibility

x_data = [[73., 80., 75.],
          [93., 88., 93.],
          [89., 91., 90.],
          [96., 98., 100.],
          [73., 66., 70.]]
y_data = [[152.],
          [185.],
          [180.],
          [196.],
          [142.]]


# placeholders for a tensor that will be always fed.
X = tf.placeholder(tf.float32, shape=[None, 3])
Y = tf.placeholder(tf.float32, shape=[None, 1])

W = tf.Variable(tf.random_normal([3, 1]), name='weight')
b = tf.Variable(tf.random_normal([1]), name='bias')

# Hypothesis
hypothesis = tf.matmul(X, W) + b # matrix multiplication.

# Simplified cost/loss function
cost = tf.reduce_mean(tf.square(hypothesis - Y))

# Minimize
optimizer = tf.train.GradientDescentOptimizer(learning_rate=1e-5)
train = optimizer.minimize(cost)

# Launch the graph in a session.
sess = tf.Session()
# Initializes global variables in the graph.
sess.run(tf.global_variables_initializer())

for step in range(2001):
    cost_val, hy_val, _ = sess.run(
        [cost, hypothesis, train], feed_dict={X: x_data, Y: y_data})
    if step % 10 == 0:
        print(step, "Cost: ", cost_val, "\nPrediction:\n", hy_val)
Matrix를 사용하게 되면 data를 표현하는 부분에 행렬식으로 표현을 해야해서
복잡해 보이는 것을 제외하면 나머지 부분들은 매우 간소화된 것을 확인할 수 있다.
몇 가지 짚고 넘어가면, X와 Y의 placeholder를 정의하는 부분에서
shape을 지정할 때, 변수 x에 대한 인스턴스의 개수는 5개로 위에서 정의했지만
몇 개가 되든 표현할 수 있게 하기 위해서 None이라는 필드를 통해
n개의 인스턴스를 표현할 수 있다.
또한 hypothesis를 지정하는 부분에서 보듯이, 행렬의 곱셈을
TensorFlow 함수인 matmul을 활용할 수 있음을 알 수 있다.(matrix multiplication)
실행 결과는 기존과 동일하다.
lab 04-2: Loading data from file
데이터가 점점 많아질수록, 데이터를 일일히 코드에 직접 적어서 사용하는 것이
불편하고 천개, 만개가 된다면 더더욱 불가능한 일이 될 것이다.
그래서 text file에 미리 데이터를 정의해두고 사용하는 방식을 채택하는데,
주로 많이들 사용하는 형식이 ,csv라는 확장자이다.
코드를 살펴보기 전에, Python에서 제공하는 list의 강력한 기능 중 하나인
Slicing에 대해서 살펴본다.
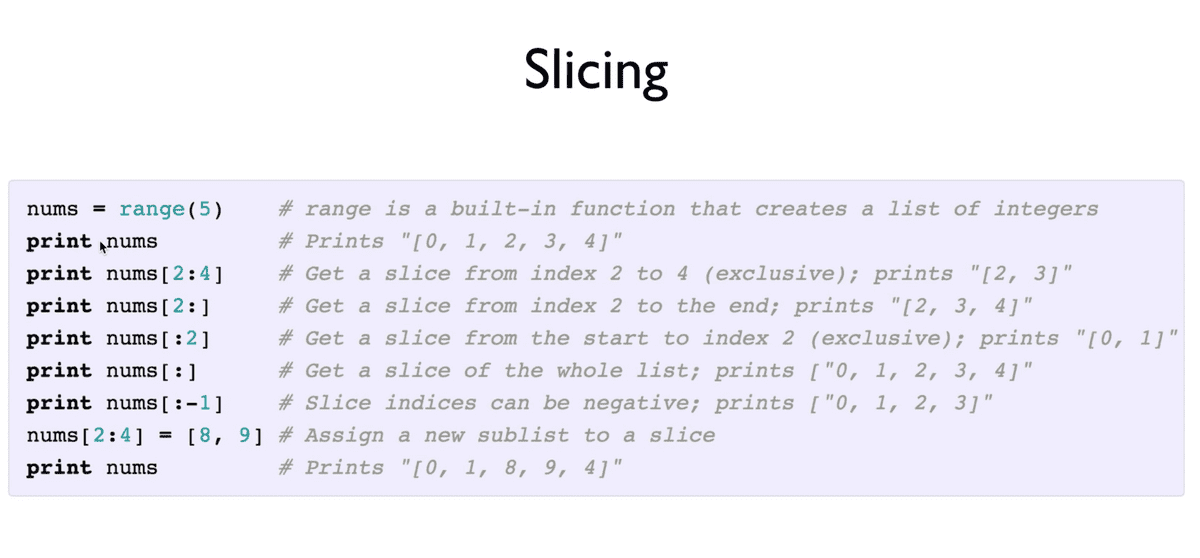
사실 필자도 이 강의를 보면서 처음 접한 내용이기도 한데
살펴보면 이러한 내용인 것 같다.
0,1,2,3,4 를 원소로 갖는 리스트가 있는데 nums[2:4]라고 작성하게 되면,
index 2번에서부터 4번째 위치한 원소까지를 리스트로 반환한다.
(개인적으로 왜 이렇게 하는지 모르겠다.)
또한 nums[:]와 같이 작성하게 되면 리스트 전체를 반환하고,
nums[:-1]과 같이 작성하면 마지막 원소를 제외하고 반환한다고 한다.
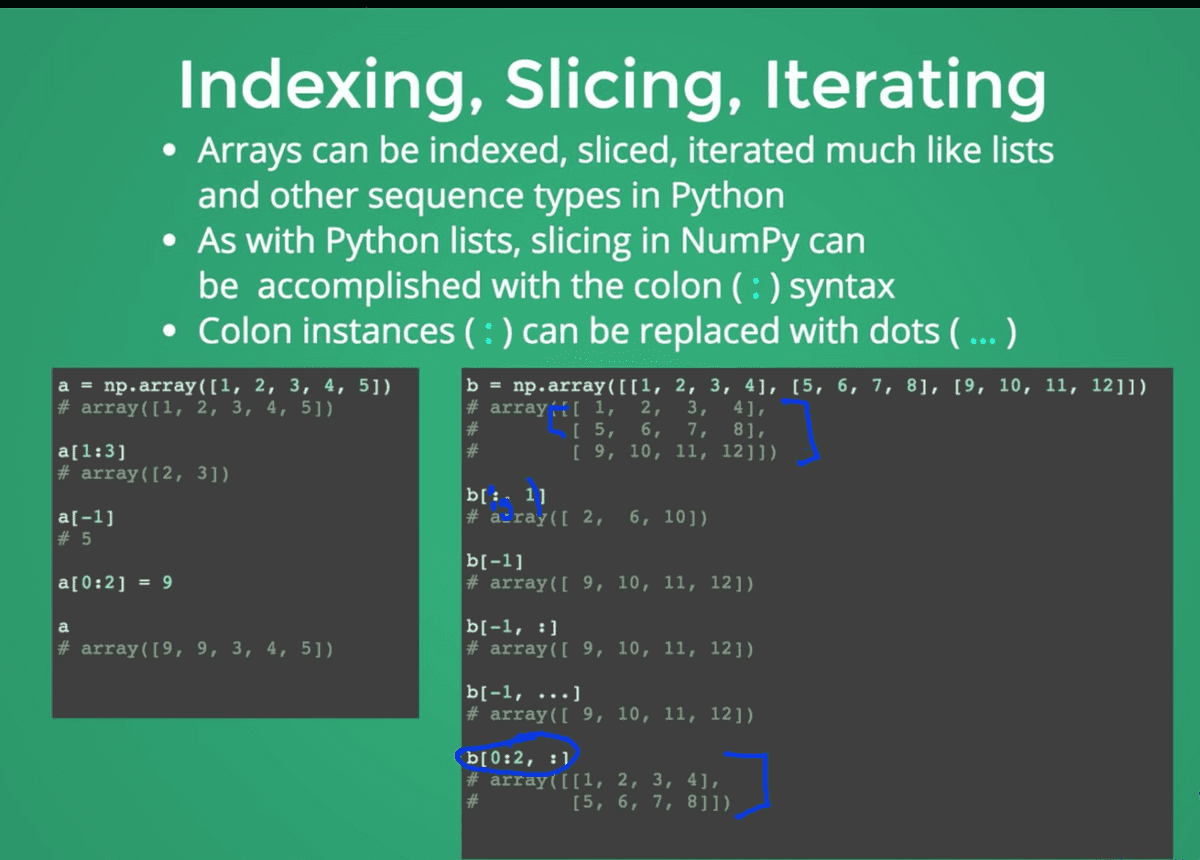
또한 Numpy에서는 더 강력한 slicing과 indexing을 제공한다고 하는데, 이는 기본 기능과 유사하며 사진을 참고하고 나중에 더 자세히 살펴보면 될 것 같다.
- data-01-test-score.csv
# EXAM1,EXAM2,EXAM3,FINAL
73,80,75,152
93,88,93,185
89,91,90,180
96,98,100,196
73,66,70,142
53,46,55,101
위와 같은 데이터를 .csv 확장자를 활용하여 파일 형태로 정의한 뒤,
아래와 같은 코드를 통해 다루는 실습을 해보자.
import tensorflow as tf
import numpy as np
tf.set_random_seed(777)  # for reproducibility

xy = np.loadtxt('data-01-test-score.csv', delimiter=',', dtype=np.float32)
x_data = xy[:, 0:-1] # 전체 n개의 행과 마지막을 제외한 열 전체를 취하겠다는 의미.
y_data = xy[:, [-1]] # 전체 n개의 행과 마지막 열에 해당하는 리스트를 반환.

# Make sure the shape and data are OK --> 학습시키기 전 가져온 데이터가 맞는지 확인.
print(x_data, "\nx_data shape:", x_data.shape)
print(y_data, "\ny_data shape:", y_data.shape)

# placeholders for a tensor that will be always fed.
X = tf.placeholder(tf.float32, shape=[None, 3])
Y = tf.placeholder(tf.float32, shape=[None, 1])

W = tf.Variable(tf.random_normal([3, 1]), name='weight') # W의 shape은 X와 Y의 shape의 조합.
b = tf.Variable(tf.random_normal([1]), name='bias')

# Hypothesis
hypothesis = tf.matmul(X, W) + b

# Simplified cost/loss function
cost = tf.reduce_mean(tf.square(hypothesis - Y))

# Minimize
optimizer = tf.train.GradientDescentOptimizer(learning_rate=1e-5)
train = optimizer.minimize(cost)

# Launch the graph in a session.
sess = tf.Session()
# Initializes global variables in the graph.
sess.run(tf.global_variables_initializer())

for step in range(2001):
    cost_val, hy_val, _ = sess.run([cost, hypothesis, train],
                                   feed_dict={X: x_data, Y: y_data})
    if step % 10 == 0:
        print(step, "Cost:", cost_val, "\nPrediction:\n", hy_val)
위와 같은 코드를 통해 학습을 시킨 후, 아래와 같이 실행하여 학습 여부를 확인해볼 수 있다.
# Ask my score
print("Your score will be ", sess.run(hypothesis,
                                      feed_dict={X: [[100, 70, 101]]}))

print("Other scores will be ", sess.run(hypothesis,
                                        feed_dict={X: [[60, 70, 110], [90, 100, 80]]}))
Your score will be [[ 181.73277283]]
Other scores will be [[ 145.86265564]
[ 187.23129272]]이처럼 Numpy를 활용하여 파일을 통해 데이터를 가져오고, 그것을 처리하는 실습을 진행했다. 그런데 File이 크거나 많아서 메모리에 한번에 올릴 수 없는 경우가 있을 수도 있다. 그래서 TensorFlow에서는 Queue Runners라는 것이 존재하는데, 이러한 문제를 TensorFlow 내에서 알아서 처리해주도록 만들어준 프로세스라고 한다. 그 동작 과정이 대략 아래와 같다.
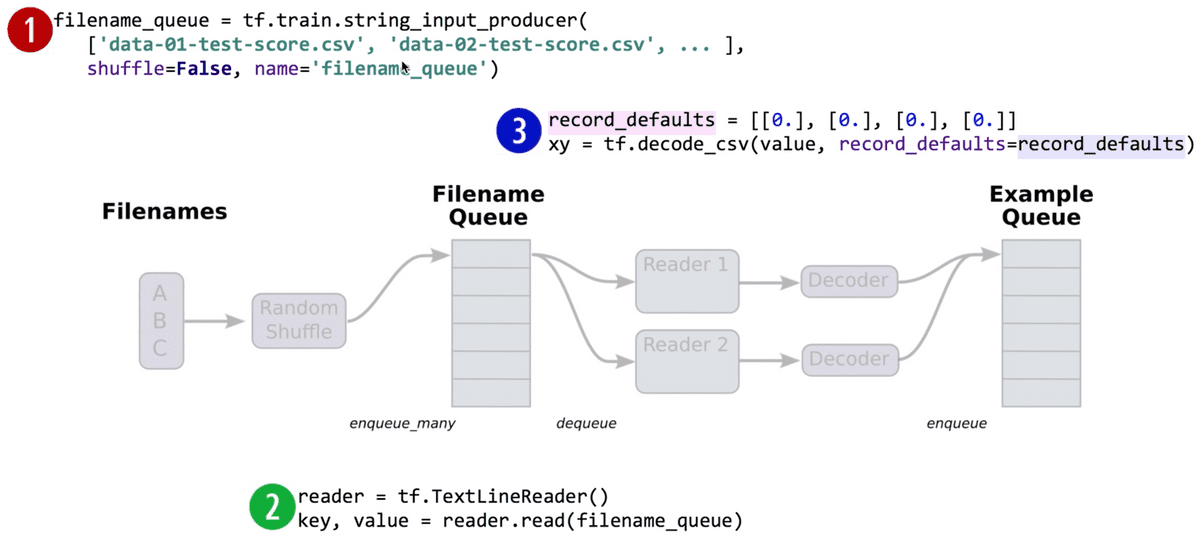
- 처리하고자 하는 파일들의 리스트를 만들어준다.
- 사용할 File Reader를 정의한다.
- 읽어온 value 값을 어떻게 파싱할지를 결정한다. (예시에서는
decode_csv)
이러한 과정들을 거친 뒤 TensorFlow에서 제공하는 batch라는 함수를 통해서
분류하고 한 번에 묶어주는 작업을 진행한다. (batch의 사전적 의미가 “일괄”이다.)
(교수님은 이 batch를 펌프에 비유하심.)
Queue Runners 방식으로 학습 데이터를 가져오는 전체 실습 코드는 아래와 같다.
import tensorflow as tf
tf.set_random_seed(777)  # for reproducibility

filename_queue = tf.train.string_input_producer(
    ['data-01-test-score.csv'], shuffle=False, name='filename_queue')

reader = tf.TextLineReader()
key, value = reader.read(filename_queue)

# Default values, in case of empty columns. Also specifies the type of the
# decoded result.
record_defaults = [[0.], [0.], [0.], [0.]]
xy = tf.decode_csv(value, record_defaults=record_defaults)

# collect batches of csv in
train_x_batch, train_y_batch = \
    tf.train.batch([xy[0:-1], xy[-1:]], batch_size=10)

# placeholders for a tensor that will be always fed.
X = tf.placeholder(tf.float32, shape=[None, 3])
Y = tf.placeholder(tf.float32, shape=[None, 1])

W = tf.Variable(tf.random_normal([3, 1]), name='weight')
b = tf.Variable(tf.random_normal([1]), name='bias')

# Hypothesis
hypothesis = tf.matmul(X, W) + b

# Simplified cost/loss function
cost = tf.reduce_mean(tf.square(hypothesis - Y))

# Minimize
optimizer = tf.train.GradientDescentOptimizer(learning_rate=1e-5)
train = optimizer.minimize(cost)

# Launch the graph in a session.
sess = tf.Session()
# Initializes global variables in the graph.
sess.run(tf.global_variables_initializer())

# Start populating the filename queue.
coord = tf.train.Coordinator()
threads = tf.train.start_queue_runners(sess=sess, coord=coord)

for step in range(2001):
    x_batch, y_batch = sess.run([train_x_batch, train_y_batch])
    cost_val, hy_val, _ = sess.run(
        [cost, hypothesis, train], feed_dict={X: x_batch, Y: y_batch})
    if step % 10 == 0:
        print(step, "Cost: ", cost_val, "\nPrediction:\n", hy_val)

coord.request_stop()
coord.join(threads)

# Ask my score
print("Your score will be ",
      sess.run(hypothesis, feed_dict={X: [[100, 70, 101]]}))

print("Other scores will be ",
      sess.run(hypothesis, feed_dict={X: [[60, 70, 110], [90, 100, 80]]}))
결과는 Numpy로 데이터를 가져왔을 때와 동일하다.
